Scope a complete reporting path.
Include the inputs, transformations and calculations that produce one business result. Shared dependencies help determine what should move together and what needs to stay connected.

From inherited analytics to explicit definitions
Moving a dashboard is only part of the work. Its numbers depend on transformations, filters and business rules accumulated over time. Trazadera modernAIze helps your team recover that logic and decide how it should live in the target platform.
Northstar University · Qlik to dbt for Databricks
Synthetic demonstration
01 / The meaning behind a number
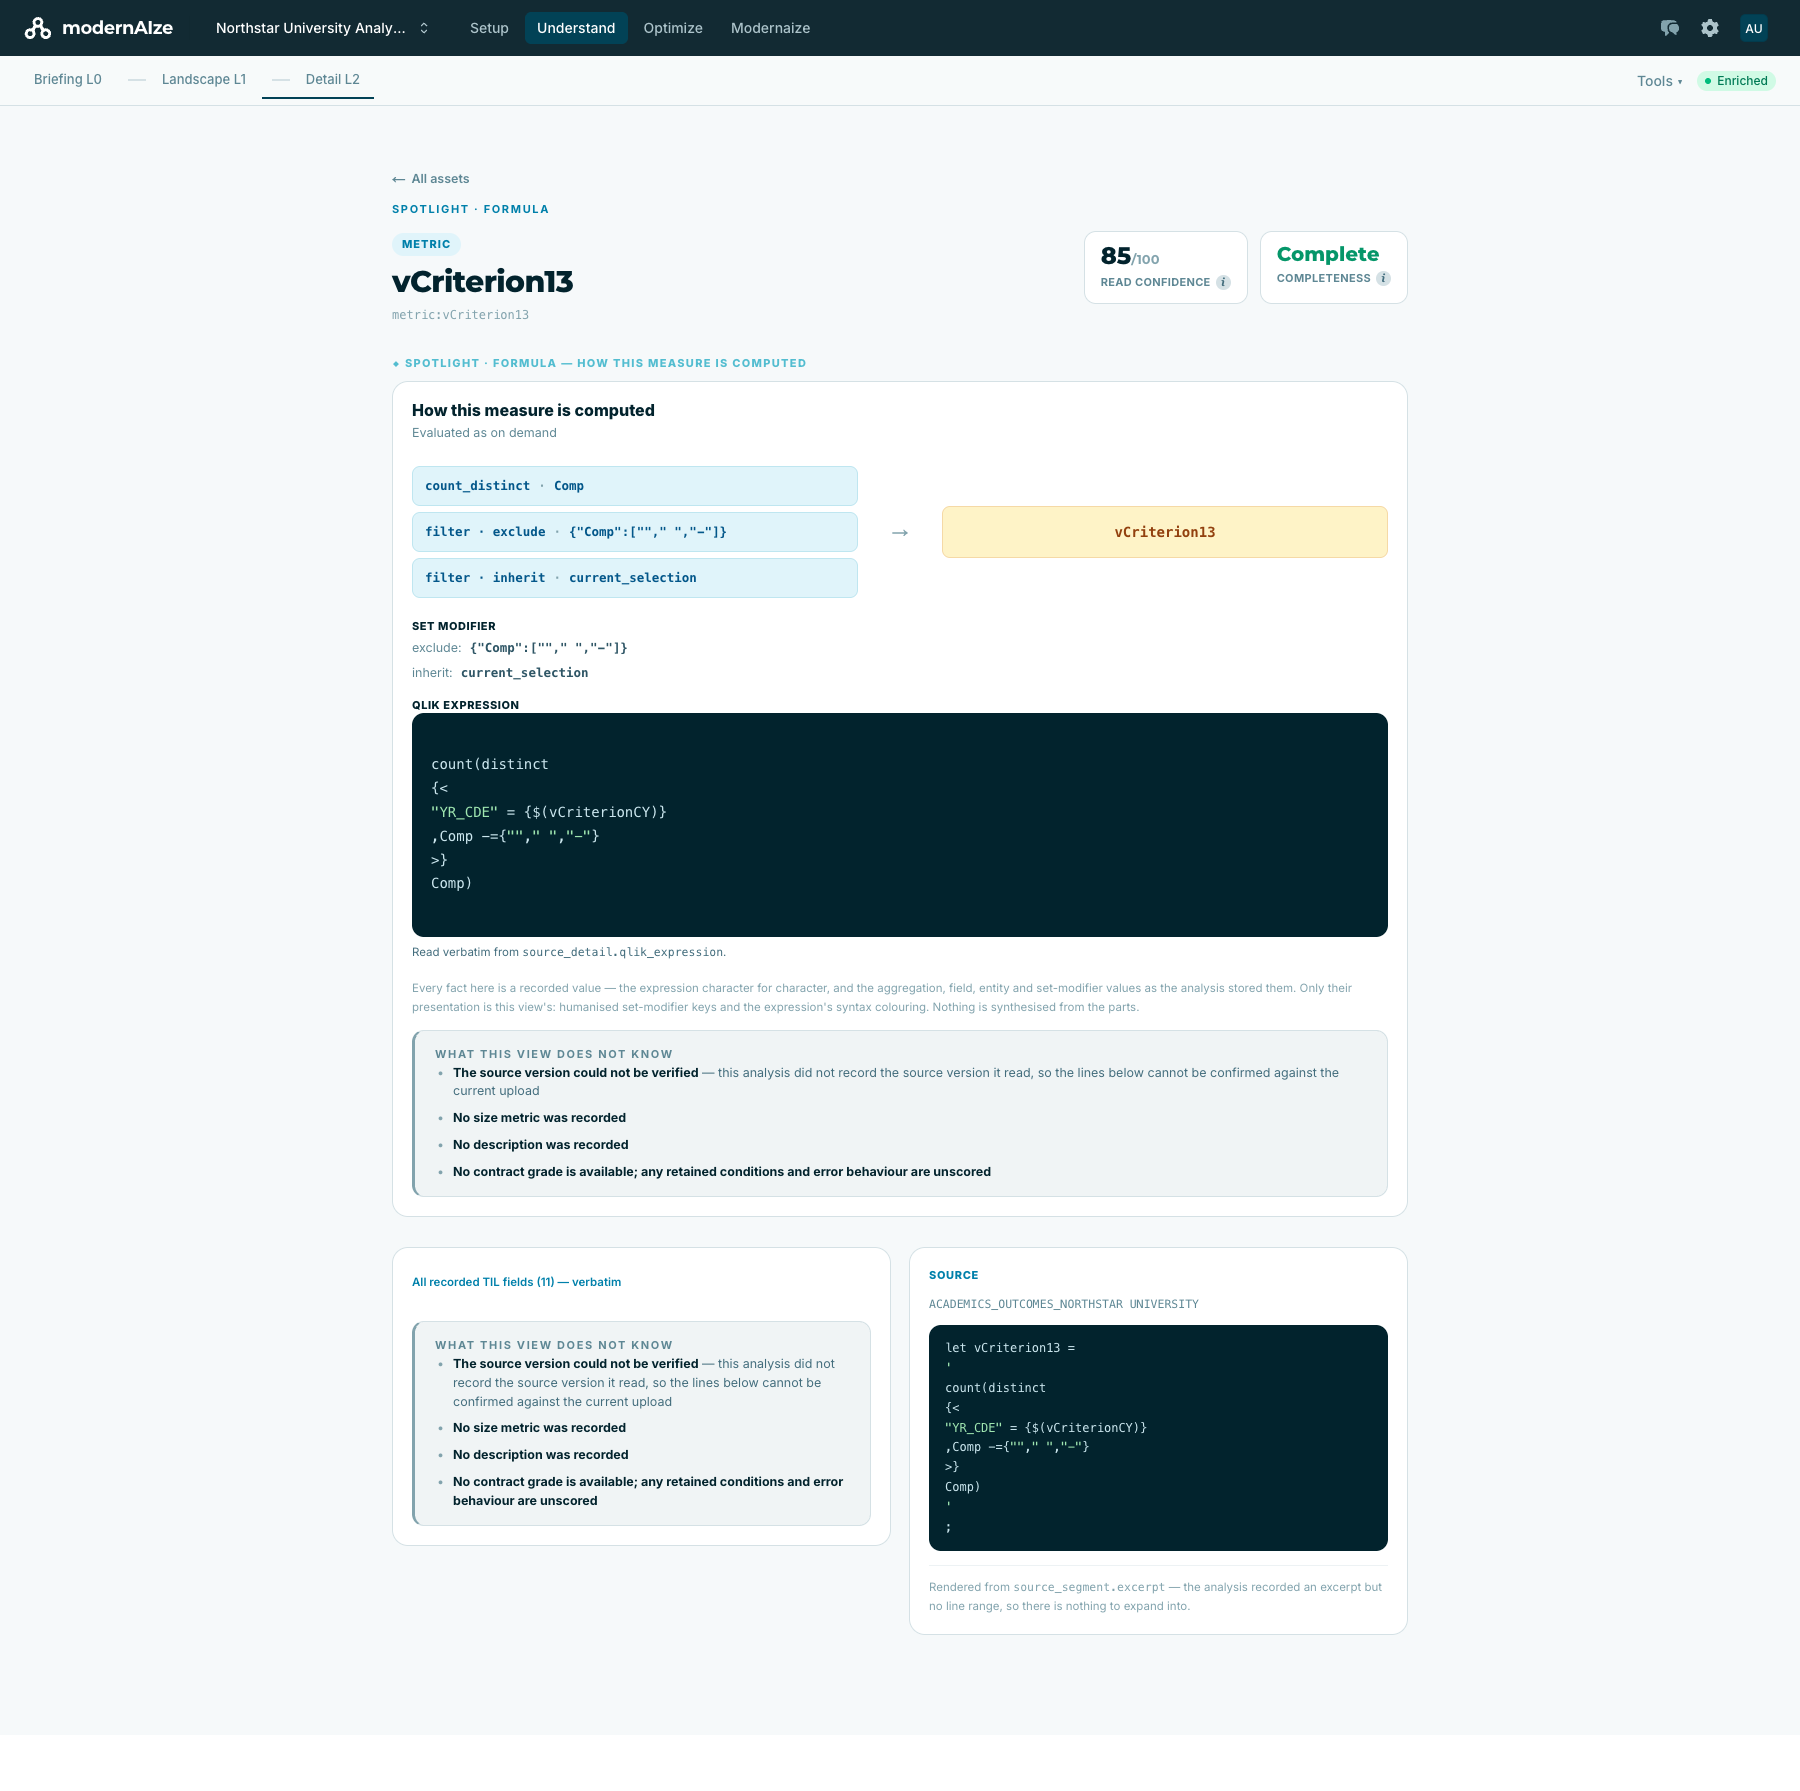
A familiar KPI can produce a different result after migration. An omitted filter or a changed period can leave teams reconciling two versions of the truth. Start by exposing the definition behind the number.
 Enlarge
Reading one real expression
Comp values and excludes empty strings, a space and a hyphen.YR_CDE is constrained by the vCriterionCY variable. The chosen year is part of the definition.02 / The system behind the report
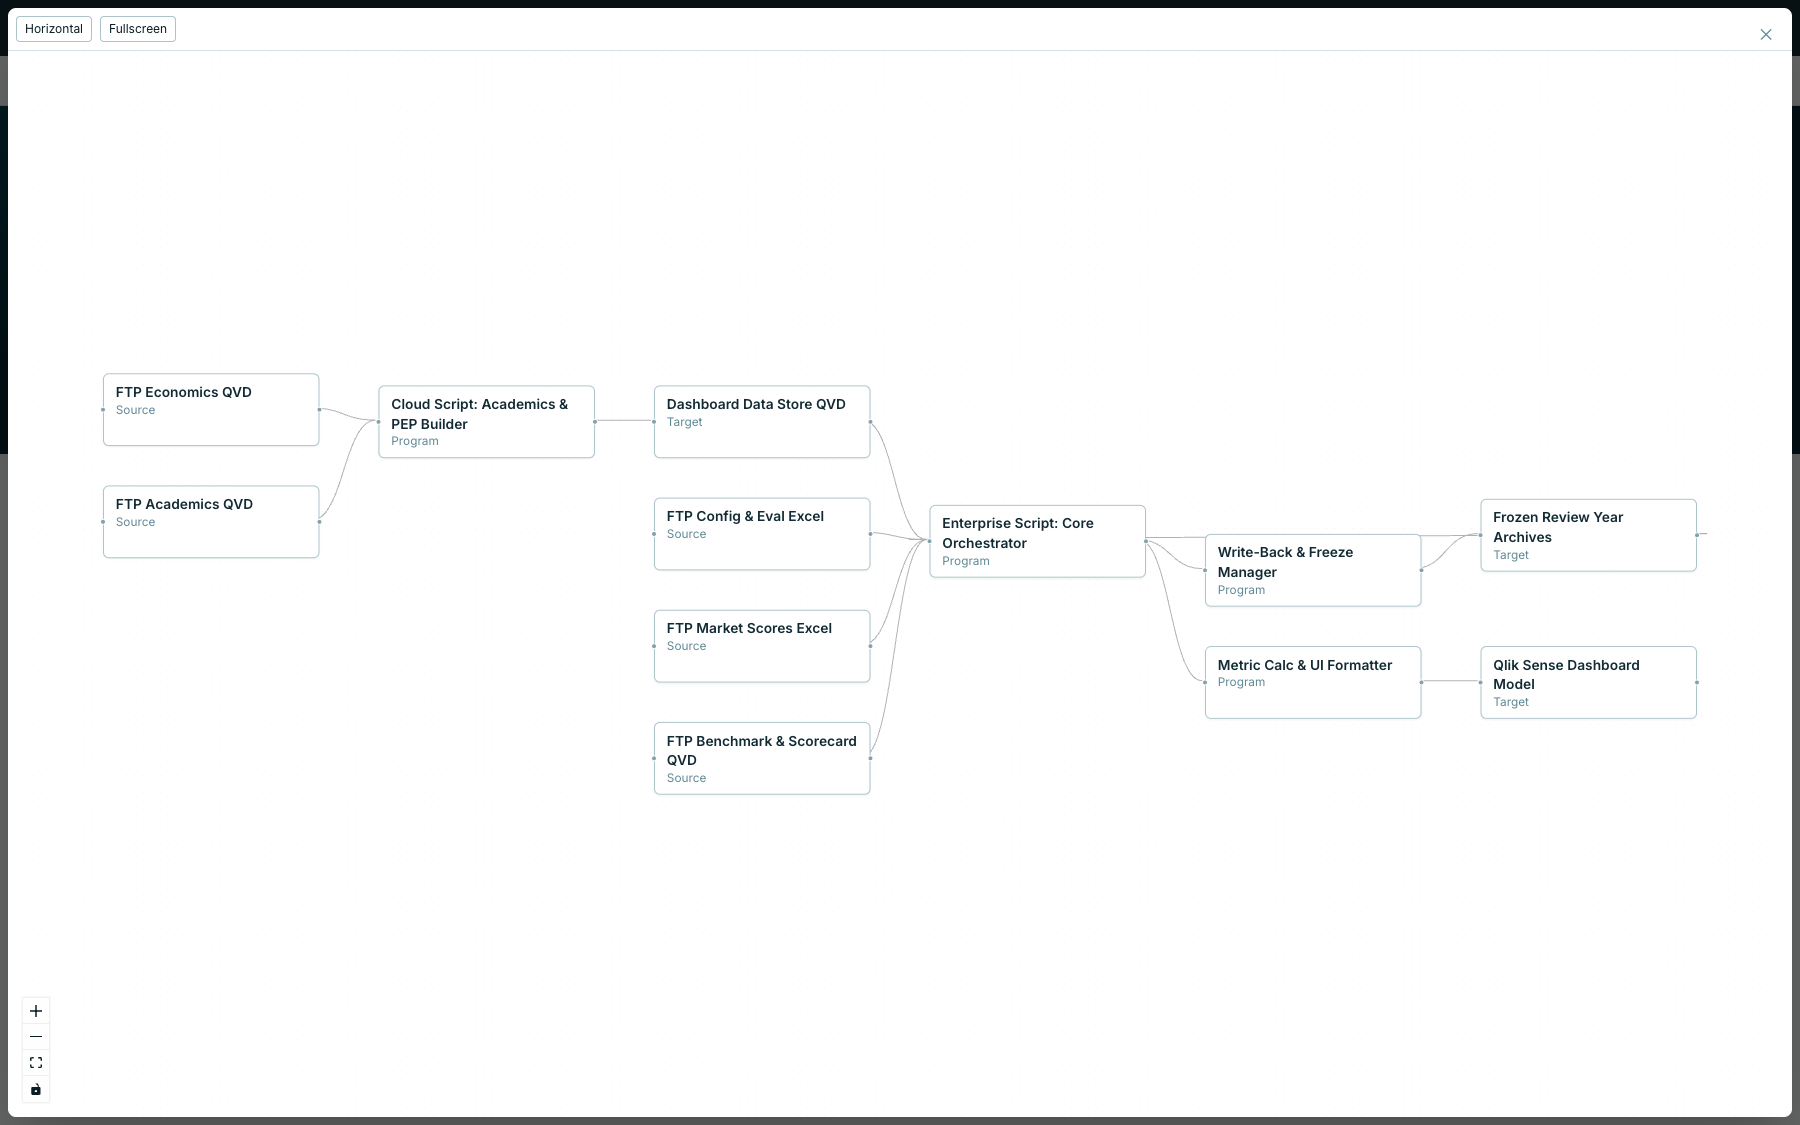
Northstar combines academic and financial extracts with configuration and benchmark data. The flow feeds both a dashboard model and frozen review-year archives. Replacing the front end leaves much of that responsibility unresolved.
 Enlarge
Include the inputs, transformations and calculations that produce one business result. Shared dependencies help determine what should move together and what needs to stay connected.
A frozen review year and a recalculated dashboard serve different purposes. Decide which outputs must remain reproducible before changing the processing underneath them.
03 / A deliberate target model
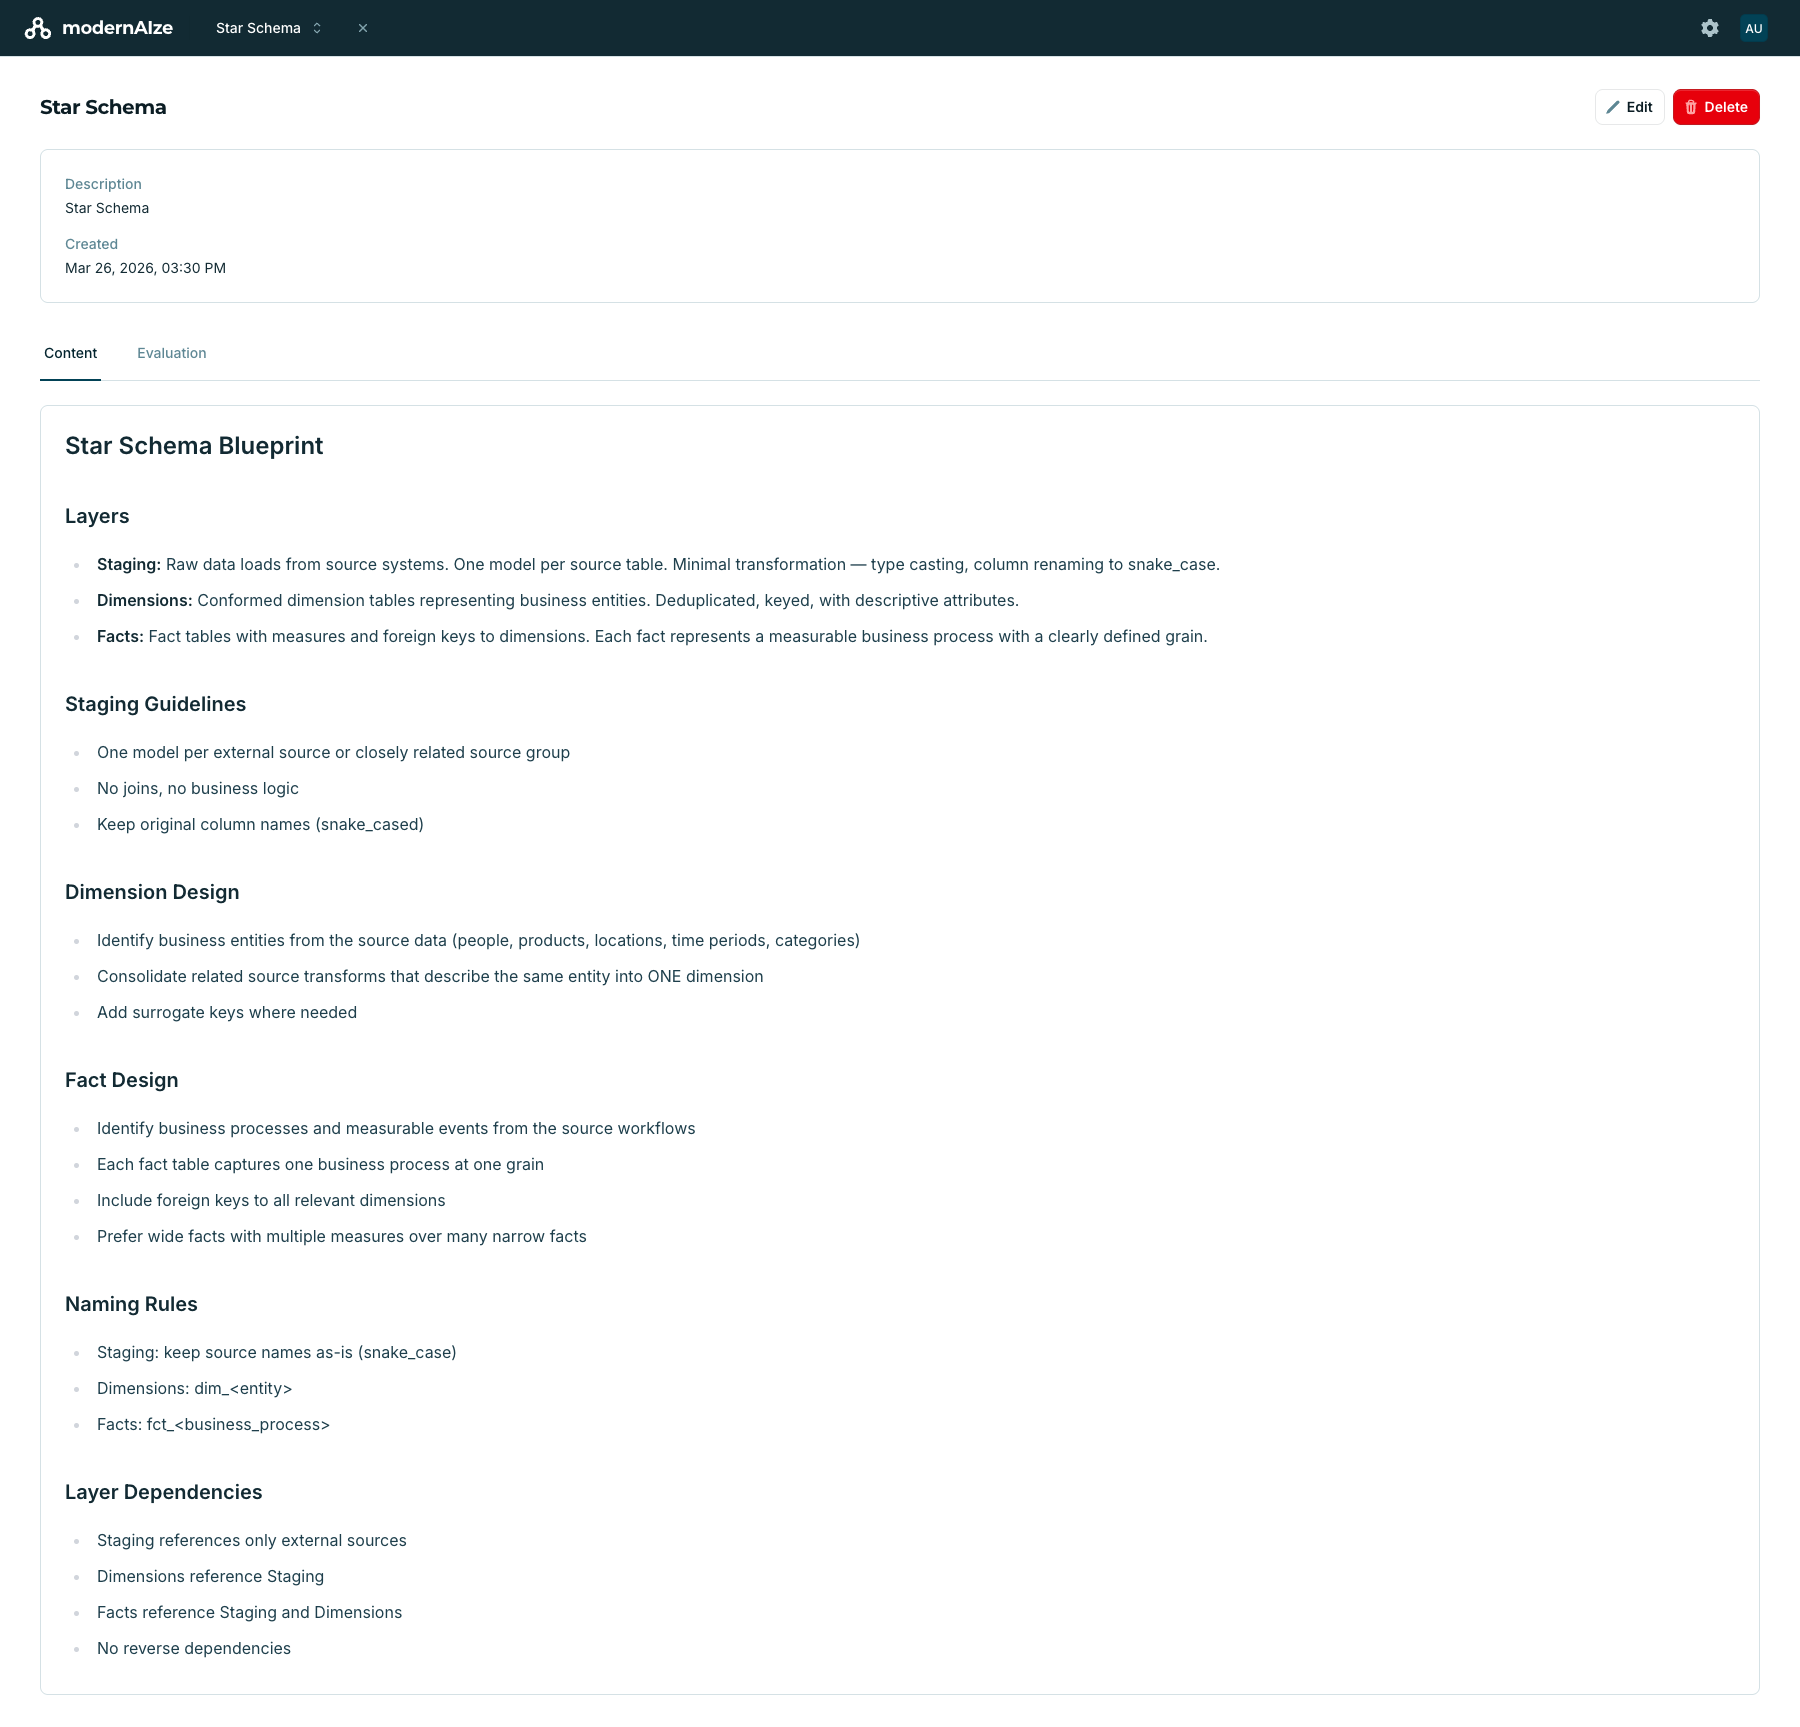
modernAIze combines deterministic parsing and AI enrichment in a semantic model your team can review. Target decisions and blueprints make the intended architecture explicit: how to organise the data, where to put shared rules and what remains in the reporting layer.
Preserve source meaning. Make names and types consistent, with a clear route back to the input.
Put reusable joins and calculations in named models. Define the grain: what one row represents.
Agree dimensions, facts and metric contracts. Decide which filters belong in the model and which remain interactive.
In the Northstar demonstration, a Star Schema Blueprint describes the intended design. The prepared dbt project contains staging and intermediate models for inspection.
 Enlarge
04 / The change you can accept
Readable SQL makes the new implementation inspectable. Business acceptance needs another step: compare agreed results for the same inputs, periods and selections. Make the checks explicit before retiring the existing reports.
The same entities, at the same level of detail. Account for duplicates, missing identifiers and excluded values.
The same year, calendar and filter state. Check frozen historical results separately from live recalculations.
Compare totals and representative records. Agree tolerances and document intentional changes with the metric owner.
The prepared persistence model looks for the next row for a student and programme. Before calling that retention, agree how to handle missed terms, repeated enrolments and the order of the academic calendar.
This is a separate model in the same demonstration estate, not the implementation of vCriterion13.
    lead(term_id) over (
      partition by student_id, program_code
      order by term_id
) as next_term_id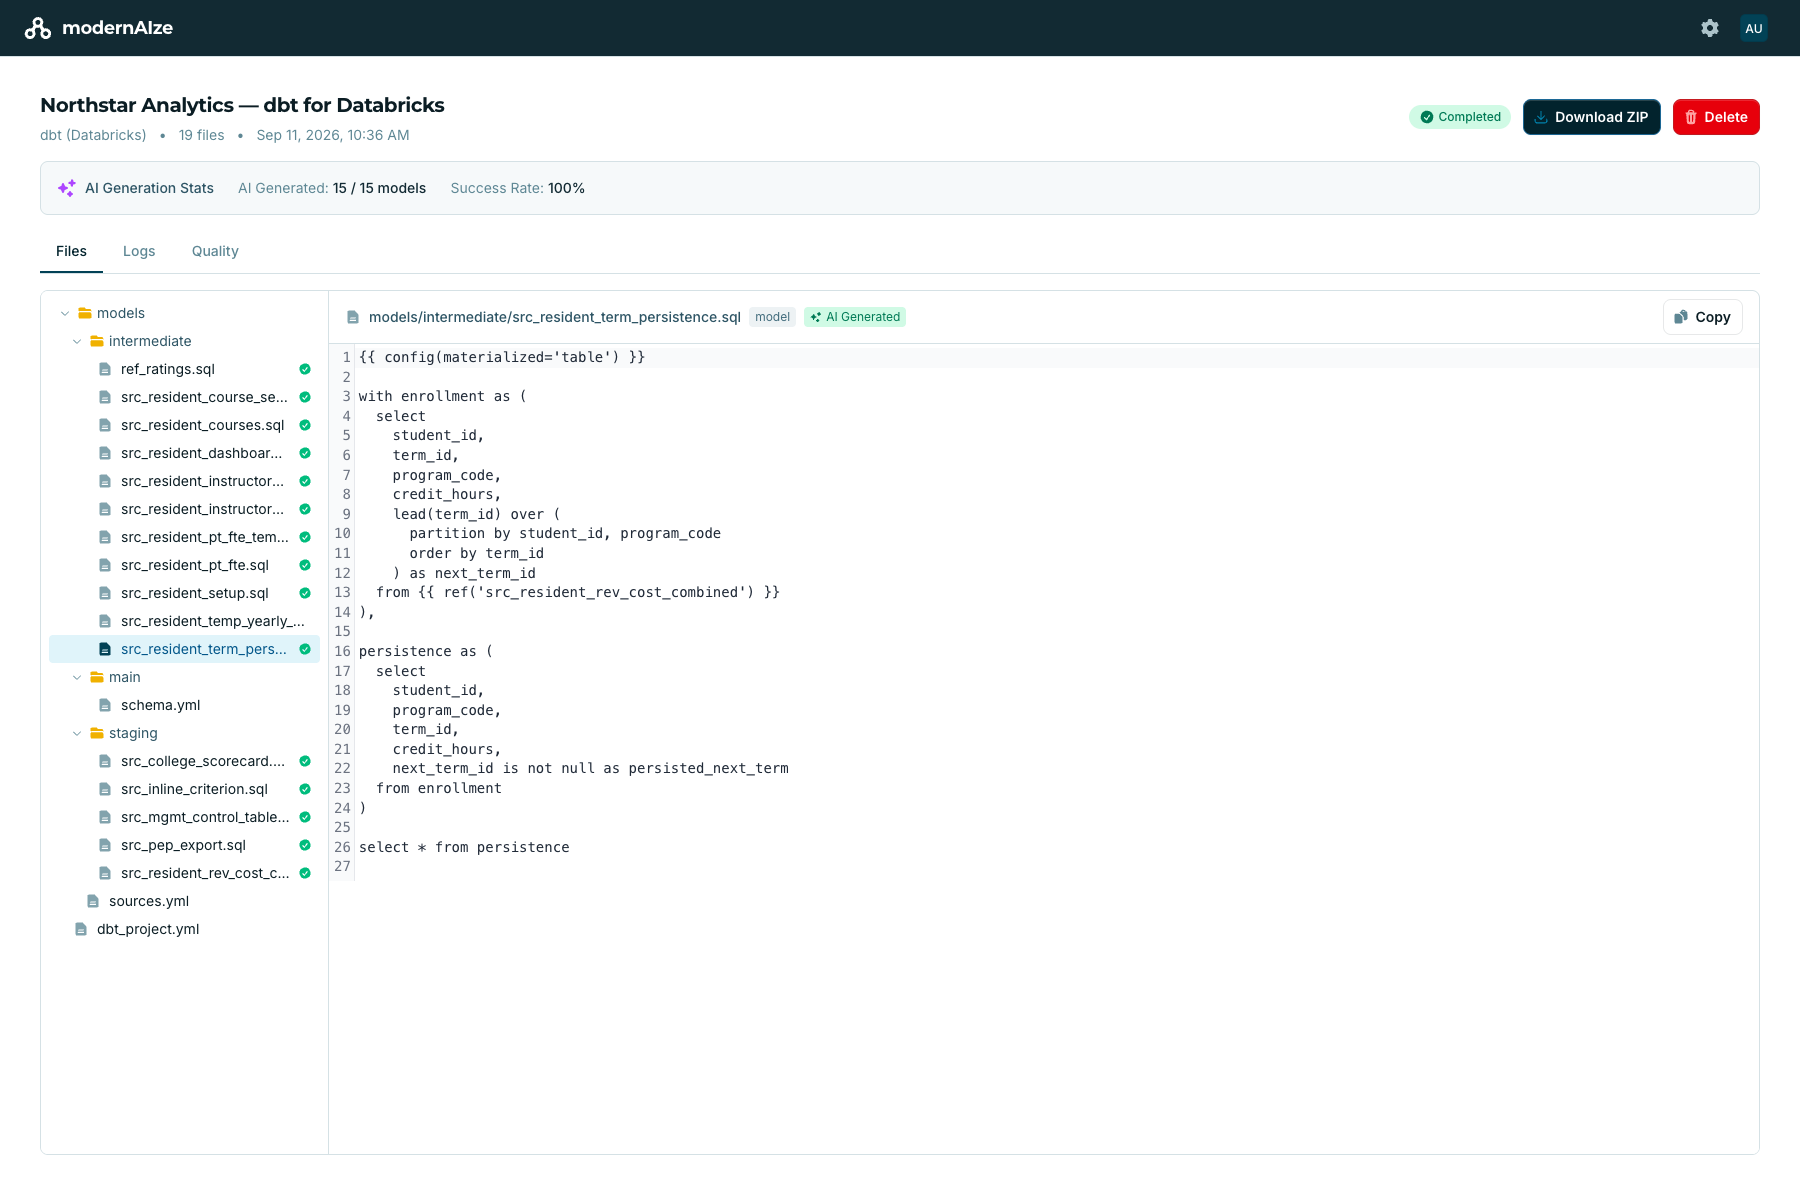 Enlarge
The Northstar output is a prepared demonstration project. Execution on Databricks and source-to-target reconciliation have not been performed for this example.
Start with one reporting path
Bring a representative report, its source scripts and a result your team already relies on. Together, we can identify the hidden rules, define the target responsibilities and agree how to check the change.
Discuss your analytics